Understanding p-values
P-values are a fundamental concept in statistical hypothesis testing, widely used in health science research. However, they are often misunderstood or misinterpreted. Here’s a comprehensive guide to help demystify p-values for health science researchers.
Definition and Purpose
A p-value is the probability of obtaining results at least as extreme as those observed, assuming the null hypothesis is true4. In simpler terms, it quantifies the likelihood that the observed data could have occurred by chance alone if there was no real effect or difference between groups.
Interpretation
- A smaller p-value suggests stronger evidence against the null hypothesis.
- Conventionally, a p-value ≤ 0.05 is considered statistically significant.
- However, statistical significance does not always equate to clinical or practical significance6.
Procedure of Null Hypothesis Significance Testing (NHST)
- Formulate null and alternative hypotheses
- Set the significance level (α)
- Choose an appropriate statistical test
- Compute the test statistic and p-value
- Compare the p-value to α and make a decision
Limitations and Misconceptions
Common Misinterpretations
- P-values do not measure the probability that the null hypothesis is true.
- They do not indicate the reproducibility of results.
- A statistically significant result doesn’t necessarily mean a large or important effect.
Overreliance on p-values
Focusing solely on p-values can lead to:
- Overlooking effect sizes and confidence intervals
- Ignoring practical or clinical significance
- Potential publication bias towards “significant” results
Best Practices for Reporting p-values
- Report exact p-values rather than thresholds (e.g., p = 0.023 instead of p < 0.05).
- Include effect sizes and confidence intervals alongside p-values.
- Interpret results in the context of the research question and clinical relevance.
- Consider using adjusted p-values for multiple comparisons.
Alternative Approaches
To enhance the robustness of research findings:
- Use confidence intervals to indicate precision of estimates
- Report effect sizes to show the magnitude of differences
- Consider Bayesian methods for a more nuanced interpretation of results
Conclusion
While p-values remain an important tool in health science research, they should not be the sole basis for drawing conclusions. Researchers should strive for a more holistic approach, considering effect sizes, confidence intervals, and practical significance alongside statistical significance. By understanding the strengths and limitations of p-values, health science researchers can more effectively interpret and communicate their findings, ultimately contributing to more reliable and reproducible research.
Important links
- The P-value: A Beginner’s Guide for Medical and Public Health Researchers. Available at https://learn.crenc.org/p-value/
- Reporting P values: A handy guide for biomedical researchers Available at https://www.editage.com/insights/reporting-p-values-a-handy-guide-for-biomedical-researchers
- Demystifying the p-value Available at https://emcrit.org/pulmcrit/demystifying-the-p-value/
- p-value demystified Available at https://pubmed.ncbi.nlm.nih.gov/32195200/
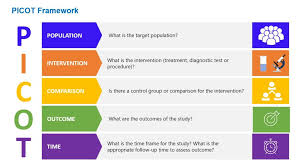
Components of PICOT
PICOT stands for:
P – Population/Patient/Problem
This component identifies the specific patient group or population being studied. It includes characteristics such as:
- Age
- Gender
- Ethnicity
- Specific health condition or disease
I – Intervention/Indicator
This refers to the main treatment, procedure, or exposure being considered. It can include:
- Medications
- Therapies
- Diagnostic tests
- Lifestyle changes
C – Comparison
This element identifies the main alternative to the intervention, such as:
- Another treatment
- Placebo
- No treatment
- Standard care
O – Outcome
This component specifies the results or effects being measured, such as:
- Symptom reduction
- Improved quality of life
- Mortality rates
- Side effects
T – Time
This optional element indicates the time frame for the study or intervention.
Benefits of Using PICOT
- Clarifies research questions
- Improves literature searches
- Enhances evidence-based practice
- Guides study design
- Facilitates critical appraisal of existing research
PICOT Templates for Different Types of Questions
Intervention/Therapy
In _______(P), what is the effect of _______(I) on ______(O) compared with _______(C) within ________ (T)?
Etiology
Are ____ (P) who have _______ (I) at ___ (Increased/decreased) risk for/of_______ (O) compared with ______ (P) with/without ______ (C) over _____ (T)?
Diagnosis
Are (is) _________ (I) more accurate in diagnosing ________ (P) compared with ______ (C) for _______ (O)?
Prevention
For ________ (P) does the use of ______ (I) reduce the future risk of ________ (O) compared with _________ (C)?
Prognosis/Prediction
Does __________ (I) influence ________ (O) in patients who have _______ (P) over ______ (T)?
Meaning
How do ________ (P) diagnosed with _______ (I) perceive ______ (O) during _____ (T)?
Tips for Writing Effective PICOT Questions
- Be concise and avoid unnecessary words
- Use key terms relevant to your topic
- Ensure all components are addressed
- Consider the feasibility of answering the question
- Review existing literature to identify gaps in knowledge
By using the PICOT framework, researchers and clinicians can develop focused, answerable questions that guide their evidence-based practice and contribute to advancing healthcare knowledge